Log Management on Amazon EKS: EFK Stack with ECK Operator and Fluent Bit

Unlike traditional Helm installs, using the ECK Operator allows Kubernetes to manage Elasticsearch as a native resource. We’ve also swapped Fluentd for Fluent Bit to keep our resource footprint tiny, ensuring that logging doesn’t eat into our application’s CPU and RAM.
We use volumeBindingMode: Immediate to ensure storage is ready the moment Elasticsearch requests it.
Using the ECK Operator, our elasticsearch.yaml is surprisingly simple. The operator automatically handles the generation of internal TLS certificates and the default elastic user password.
Highlights: We’ve limited the JVM heap to 512MB (
ES_JAVA_OPTS) to stay cost-effective while keeping the deployment stable with 10Gi of EBS storage.
Step 3: Visualizing with Kibana
Kibana is our window into the logs. In kibanaDeployment.yaml, we don’t need to manually provide Elasticsearch URLs; the elasticsearchRef field tells the Operator to link them automatically.
Access: To make it reachable, we use
kibanaService.yamlwhich creates an AWS LoadBalancer, giving us a public URL to access our dashboards.
Step 4: The Log Shipper (Fluent Bit)
This is where the heavy lifting happens. We deploy Fluent Bit as a DaemonSet, meaning one pod runs on every single worker node in the EKS cluster.
fluent-bit-DaemonSet.yamlincludes aninitContainer. It “pings” Elasticsearch and waits for it to be fully healthy before Fluent Bit starts shipping logs.Security: We don’t hardcode passwords. Fluent Bit pulls the
ELASTIC_PASSWORDdirectly from the Secret that the ECK Operator created.
Key Configuration: Fluent Bit Logic
The magic is in the fluent-bit-config.yaml. We’ve broken it down into four stages:
Input Section (input-kubernetes.conf)
This section defines how Fluent Bit reads the raw log files from the Kubernetes nodes.
Name tail: Tells Fluent Bit to use the “tail” input plugin, which reads files like the Linux
tailcommand.Path /var/log/containers/*.log: Specifies the exact location on the node where Kubernetes stores container logs.
Tag kube.*: Assigns a tag starting with
kube.to all logs collected from this path, allowing them to be targeted by specific filters later.Parser docker: Uses a predefined JSON parser to structure raw logs coming from Docker/CRI-O.
Mem_Buf_Limit 5MB: Limits memory usage for this input to 5MB to prevent the Fluent Bit agent from consuming too much RAM.
Skip_Long_Lines On: Skips lines that exceed the buffer size instead of crashing the plugin.
DB /var/log/flb_kube.db: Maintains an SQLite database to track which parts of the log files have already been read, ensuring no logs are lost if the pod restarts.
Read_from_Head False: Starts reading from the end of the file (new logs) rather than the beginning of old files.
2. Filter Section (filter-kubernetes.conf)
This section enriches raw logs with Kubernetes-specific information like pod names, namespaces, and labels.
Name kubernetes: Uses the Kubernetes filter plugin to communicate with the API server.
Match kube.*: Applies this filter only to logs that were tagged with
kube.in the input step.Kube_URL / Kube_CA_File / Kube_Token_File: Standard credentials used by the filter to securely authenticate with the Kubernetes API.
Kube_Tag_Prefix kube.var.log.containers.: Helps the filter extract the pod name and namespace directly from the file path.
Merge_Log On / Merge_Log_Key log_processed: If the log is a JSON string, it merges those fields into the main log record under the key
log_processed.Keep_Log Off: Discards the original unparsed “log” field after successful merging to save space.
3. Output Section (output-elasticsearch.conf)
This section defines where the processed logs are sent for storage and visualization.
Name es: Uses the Elasticsearch output plugin.
Host / Port: Points to the Elasticsearch service address and port (
9200) within the cluster.Index / Logstash_Prefix k8s-logs: Sets the naming convention for the indices created in Elasticsearch.
tls On / tls.verify On / tls.ca_file: Enables encrypted communication and specifies the certificate to verify the Elasticsearch server.
HTTP_User / HTTP_Passwd: Authenticates with Elasticsearch using the default
elasticuser and a password pulled from a secure environment variable.Logstash_Format On: Formats the index names as
prefix-YYYY.MM.DD, which is the standard format used by Kibana.Retry_Limit False: Tells Fluent Bit to keep trying to send logs if the connection to Elasticsearch is temporarily lost.
Manifest files are available here
Prerequisites
Install the ECK Operator
The Operator itself is installed cluster-wide. We’ll use the official manifest files from Elastic.These teach your Kubernetes cluster what an Elasticsearch and Kibana resource looks like.
kubectl create -f https://download.elastic.co/downloads/eck/3.2.0/crds.yamlThis deploys the actual Operator logic (the controller) into the elastic-system namespace.
kubectl apply -f https://download.elastic.co/downloads/eck/3.2.0/operator.yamlVerify Operator Status:
kubectl get -n elastic-system pods
NAME                 READY   STATUS    RESTARTS   AGE
elastic-operator-0   1/1     Running   0          135m
Deploy EFK stack:
kubectl apply -f namespace.yaml
kubectl apply -f storageClass.yaml
kubectl apply -f elasticsearch.yaml
kubectl apply -f kibanaService.yaml
kubectl apply -f kibanaDeployment.yaml
kubectl apply -f fluent-bit-RBAC.yaml
kubectl apply -f fluent-bit-config.yaml
kubectl apply -f fluent-bit-DaemonSet
Check deployment:
kubectl get all -n efklog
NAME                                     READY   STATUS    RESTARTS   AGE
pod/elasticsearch-logging-es-default-0   1/1     Running   0          108m
pod/fluent-bit-9qhsl                     1/1     Running   0          68m
pod/fluent-bit-cpvfb                     1/1     Running   0          68m
pod/kibana-logging-kb-658c9bb7bb-fcxjt   1/1     Running   0          79m

NAME                                             TYPE           CLUSTER-IP      EXTERNAL-IP                                                                PORT(S)          AGE
service/elasticsearch-logging-es-default         ClusterIP      None            <none>                                                                     9200/TCP         108m
service/elasticsearch-logging-es-http            ClusterIP      10.100.34.105   <none>                                                                     9200/TCP         108m
service/elasticsearch-logging-es-internal-http   ClusterIP      10.100.187.1    <none>                                                                     9200/TCP         108m
service/elasticsearch-logging-es-transport       ClusterIP      None            <none>                                                                     9300/TCP         108m
service/kibana-logging-external                  LoadBalancer   10.100.17.186   a37a47b7e1cd2441fa8d78dfb0e9b041-64884497.eu-central-1.elb.amazonaws.com   5601:31515/TCP   105m
service/kibana-logging-kb-http                   ClusterIP      10.100.38.21    <none>                                                                     5601/TCP         79m

NAME                        DESIRED   CURRENT   READY   UP-TO-DATE   AVAILABLE   NODE SELECTOR   AGE
daemonset.apps/fluent-bit   2         2         2       2            2           <none>          76m

NAME                                READY   UP-TO-DATE   AVAILABLE   AGE
deployment.apps/kibana-logging-kb   1/1     1            1           79m

NAME                                           DESIRED   CURRENT   READY   AGE
replicaset.apps/kibana-logging-kb-658c9bb7bb   1         1         1       79m

NAME                                                READY   AGE
statefulset.apps/elasticsearch-logging-es-default   1/1     108m
Get Kibana password:
kubectl get secret elasticsearch-logging-es-elastic-user -n efklog -o jsonpath=’{.data.elastic}’ | base64 --decodeLogin to Kibana Web Gui using Load Balancer service
https://a37a47b7e1cd2441fa8d78dfb0e9b041-64884497.eu-central-1.elb.amazonaws.com:5601 in this case, username elastic
password from above step
kubectl get svc -n efklog
NAME TYPE CLUSTER-IP EXTERNAL-IP PORT(S) AGE
elasticsearch-logging-es-default ClusterIP None <none> 9200/TCP 110m
elasticsearch-logging-es-http ClusterIP 10.100.34.105 <none> 9200/TCP 110m
elasticsearch-logging-es-internal-http ClusterIP 10.100.187.1 <none> 9200/TCP 110m
elasticsearch-logging-es-transport ClusterIP None <none> 9300/TCP 110m
kibana-logging-external LoadBalancer 10.100.17.186 a37a47b7e1cd2441fa8d78dfb0e9b041-64884497.eu-central-1.elb.amazonaws.com 5601:31515/TCP 107m
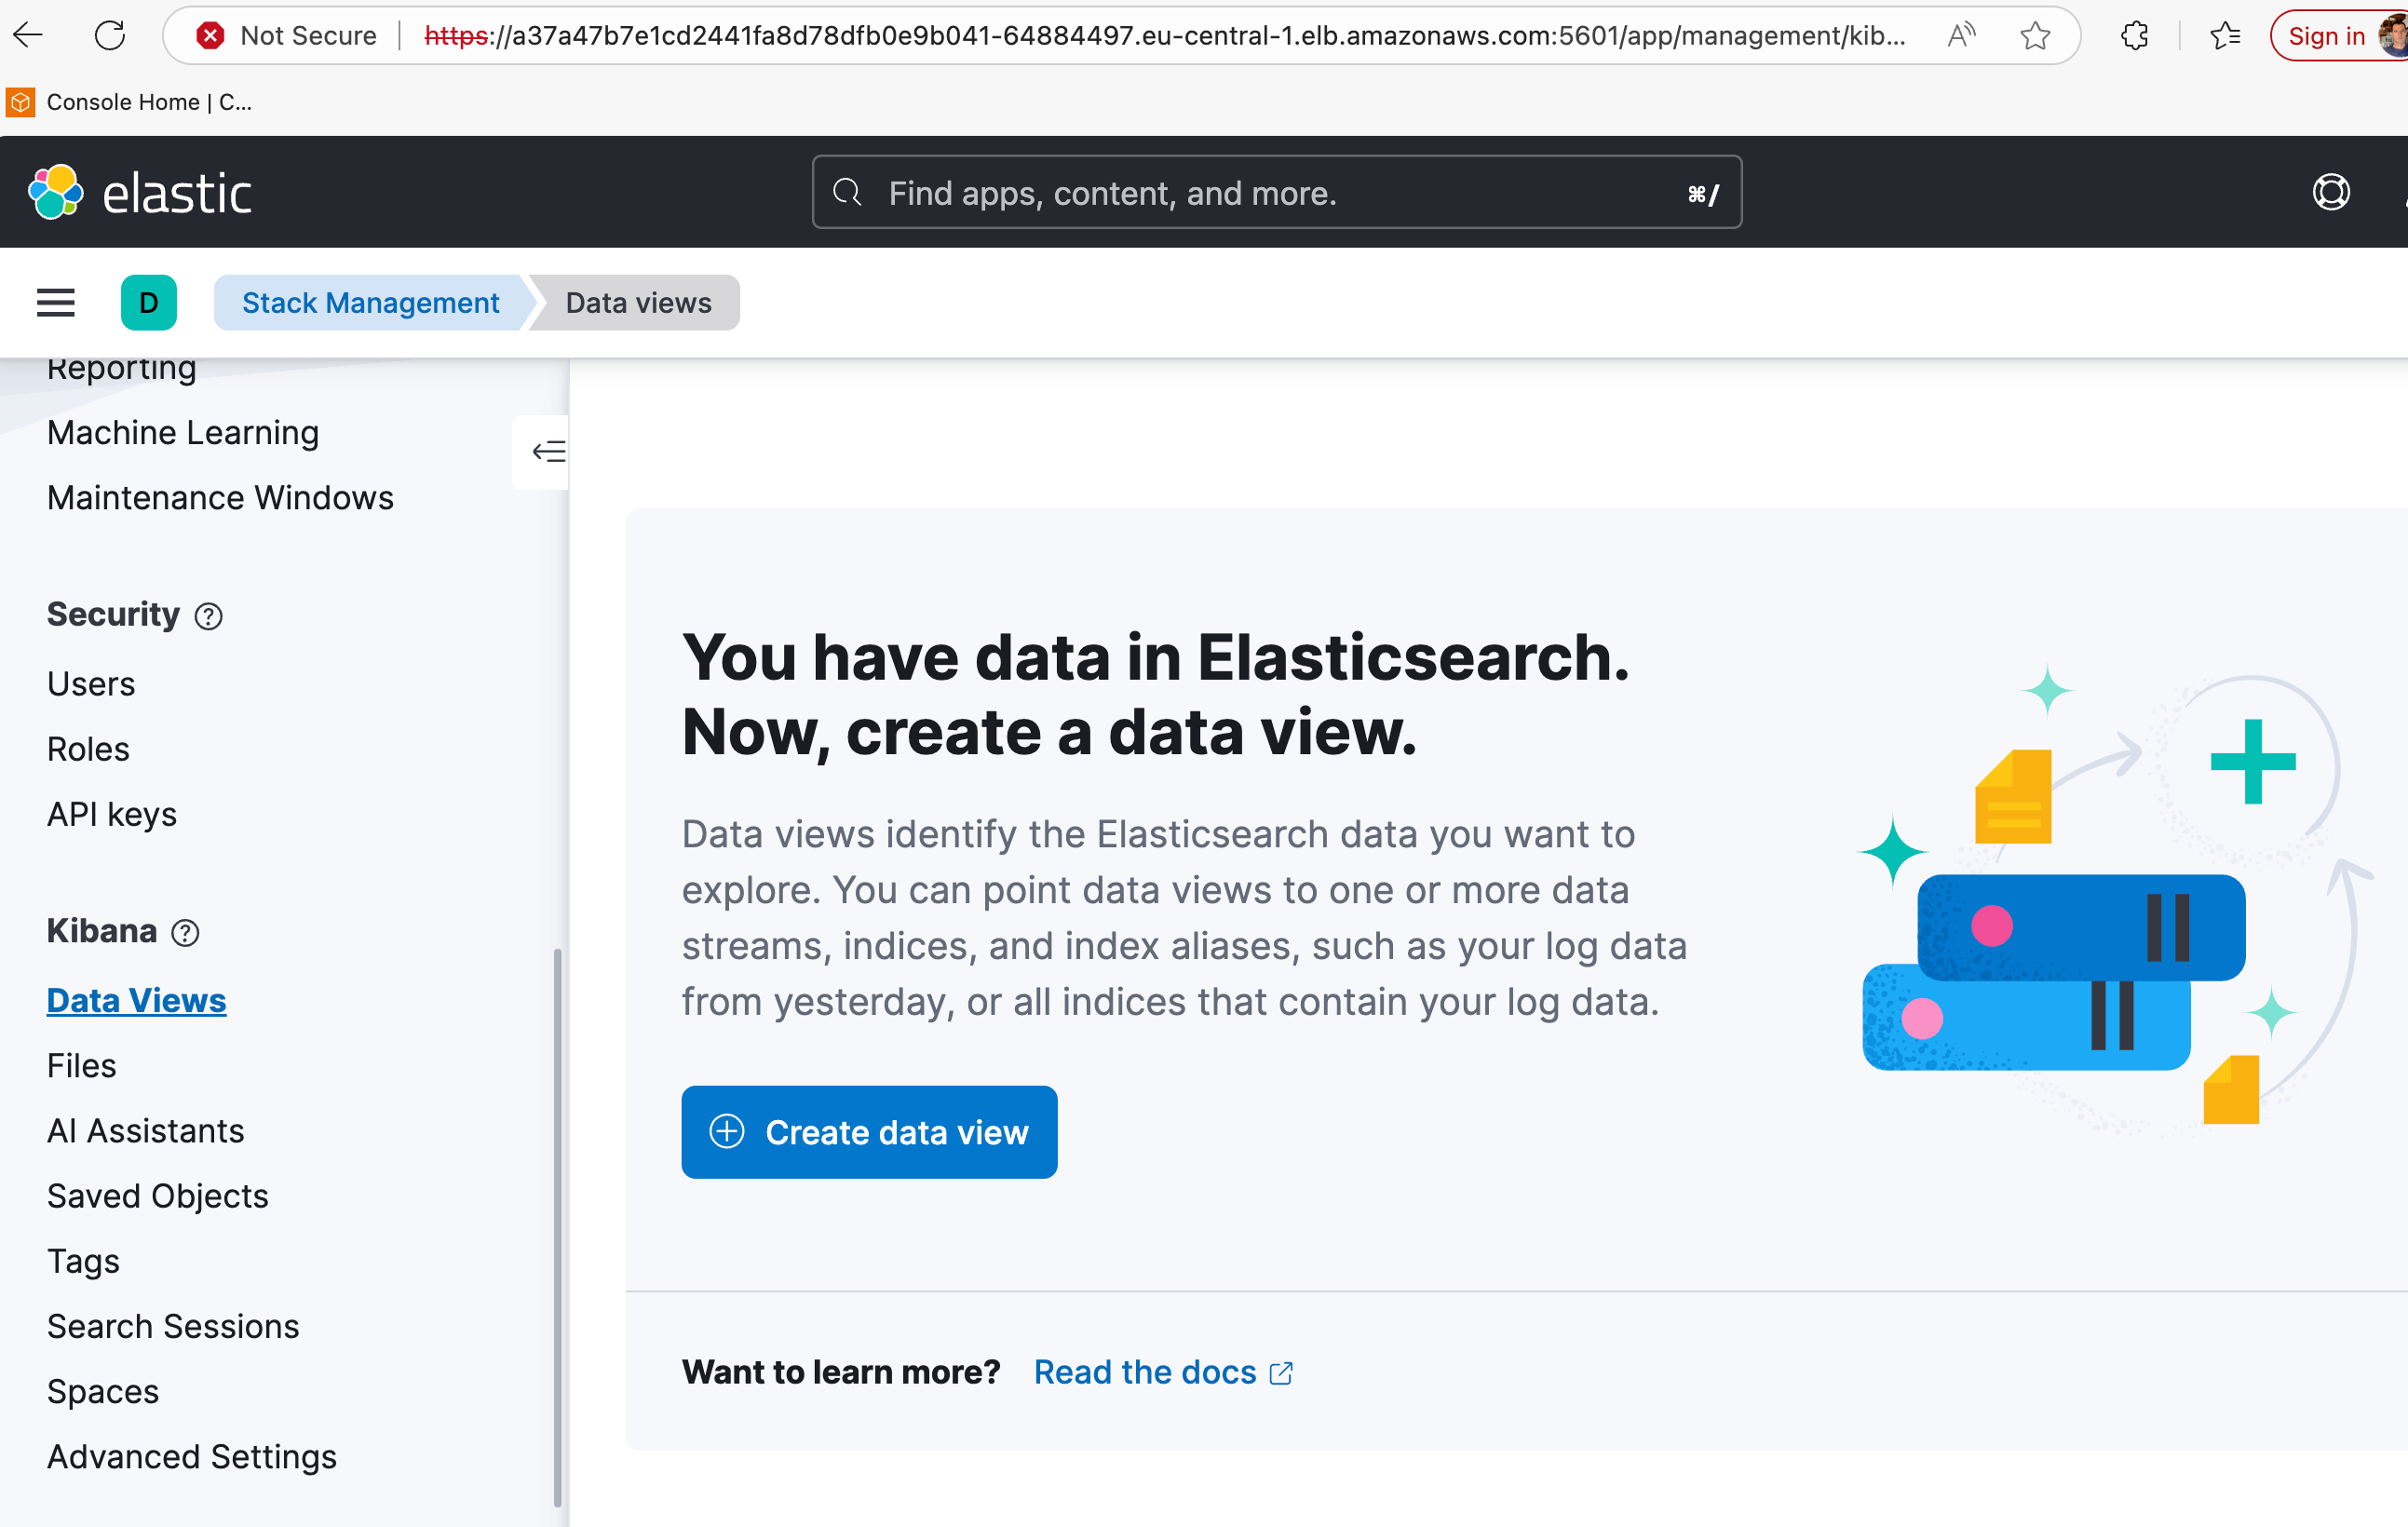
kibana-logging-kb-http ClusterIP 10.100.38.21 <none> 5601/TCP 81mWhen you access Kibana, the certificate warning occurs because the ECK (Elastic Cloud on Kubernetes) Operator automatically generates a self-signed CA to secure communication. Since your browser does not recognize or trust this internal Elastic CA, it flags the connection as “Not Secure.”
To resolve this and use your own trusted certificate (e.g., from Let’s Encrypt or your organization’s CA), you need to provide your certificate as a Kubernetes Secret and update the Kibana resource.First, you must package your certificate (tls.crt) and private key (tls.key) into a Secret within the efklog namespace.
kubectl create secret tls kibana-custom-cert \
  --cert=path/to/your/cert.crt \
  --key=path/to/your/key.key \
  -n efklog
We need to modify Kibana manifest (similar to elasticsearch.yaml structure) to tell the Operator to use your secret instead of generating its own.
Add the http section under spec:
apiVersion: kibana.k8s.elastic.co/v1
kind: Kibana
metadata:
name: kibana-logging
namespace: efklog
spec:
version: 8.12.2
count: 1
elasticsearchRef:
name: elasticsearch-logging
http:
tls:
selfSignedCertificate:
disabled: true # Disable the auto-generated cert
certificate:
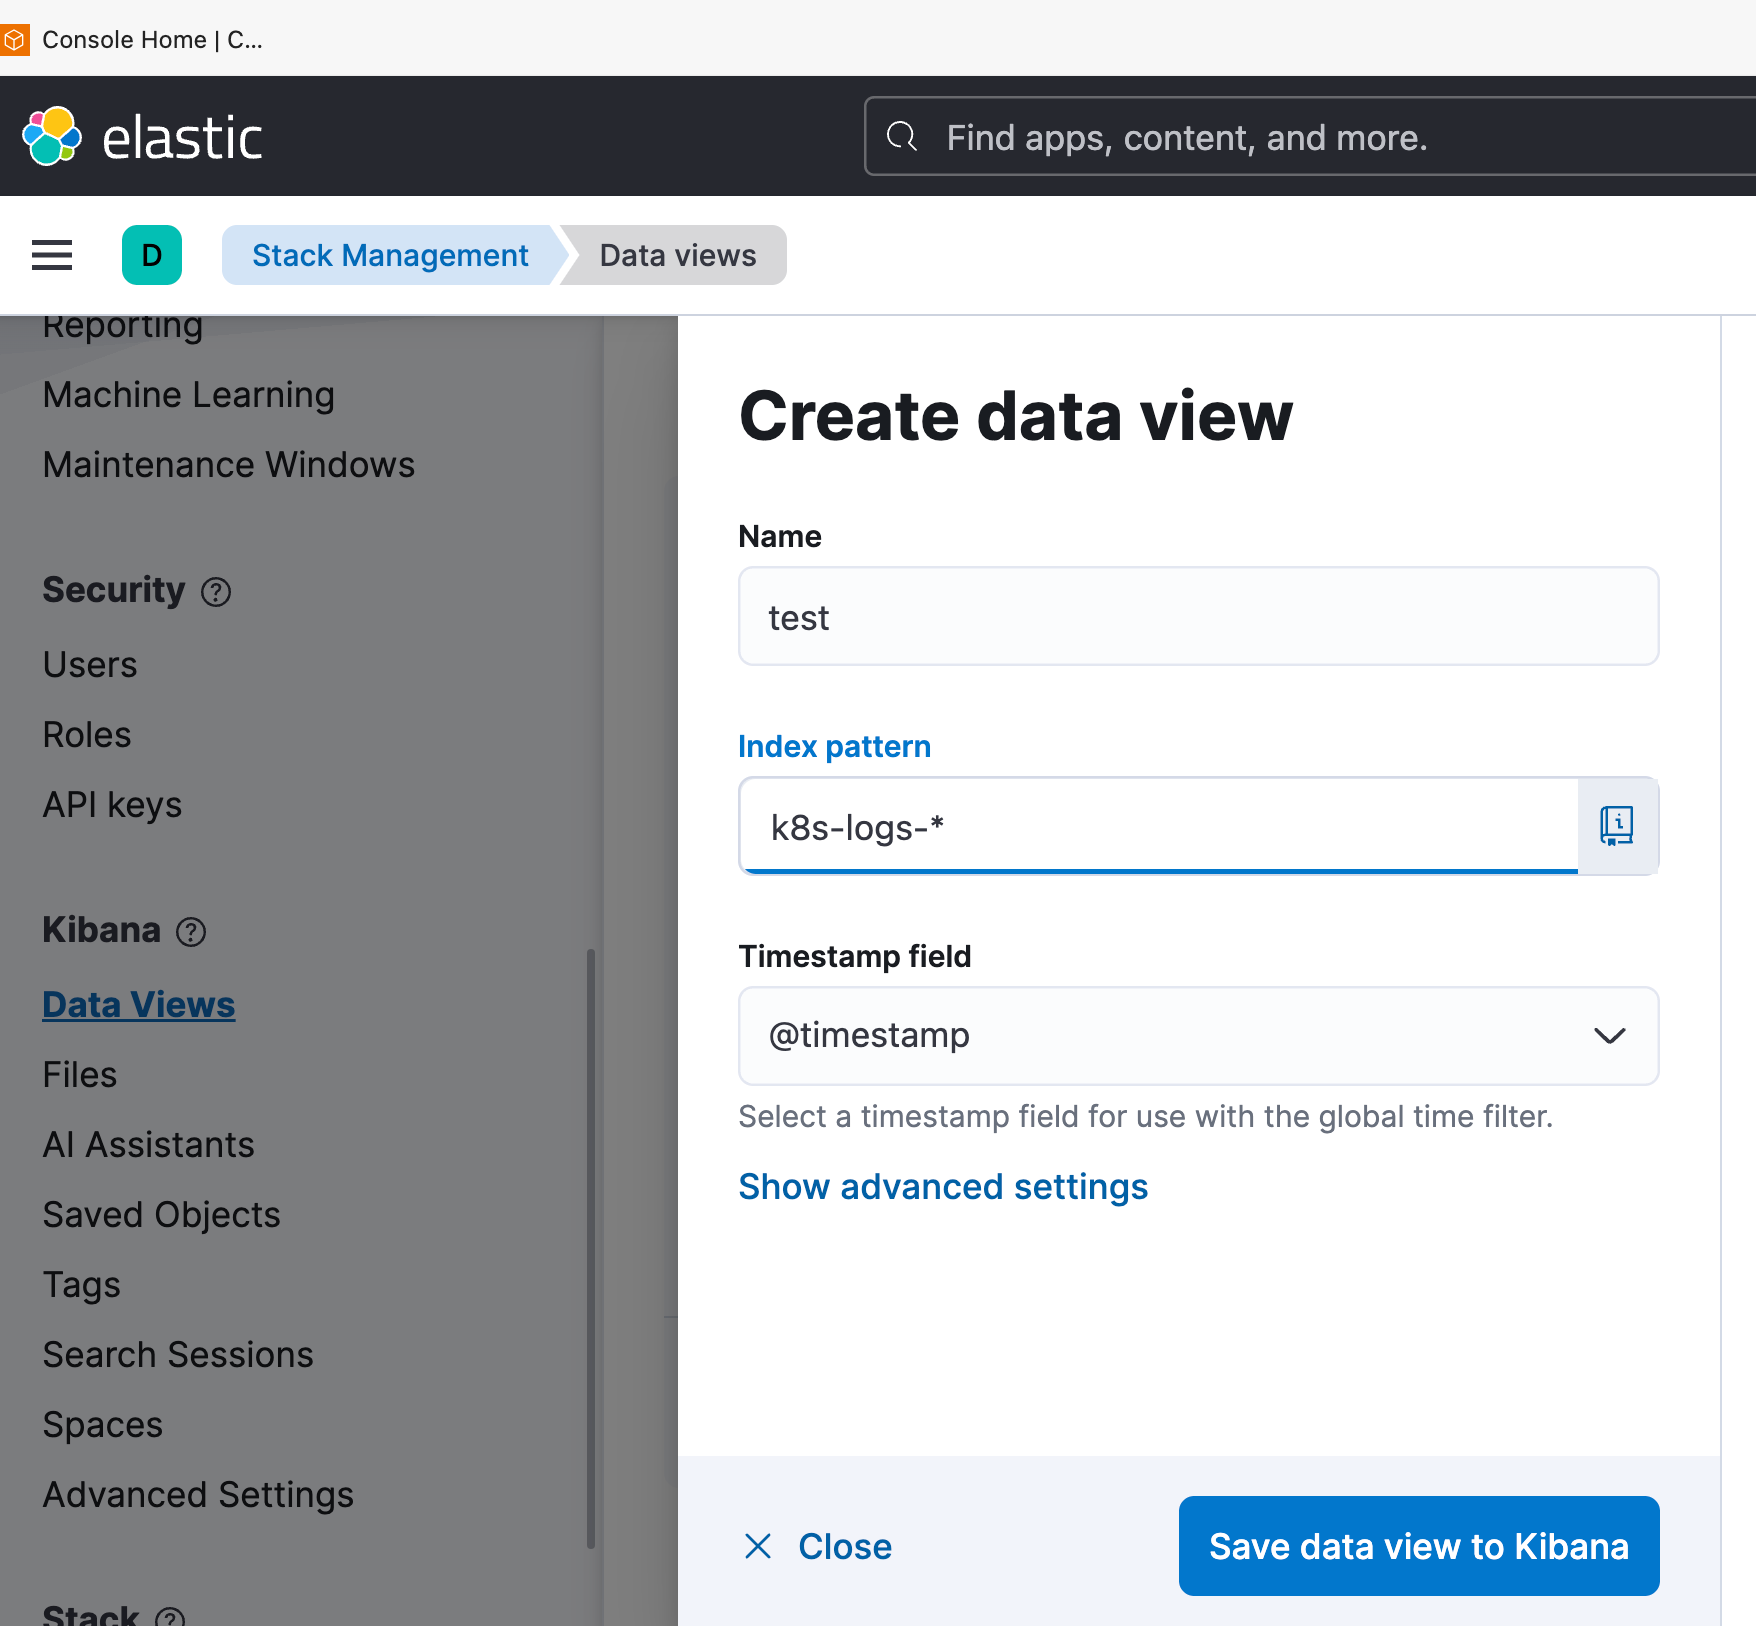
secretName: kibana-custom-cert # Use your created secretIn Kibana Dashboard-Kibana-Data views-Create Data view
Name: Enter a name (e.g.,
k8s-logs-new).Index pattern: Enter
k8s-logs-*. This must match theLogstash_Prefixdefined in youroutput-elasticsearch.conf.Timestamp field: Select
@timestampfrom the dropdown menu.Click Save data view to Kibana.
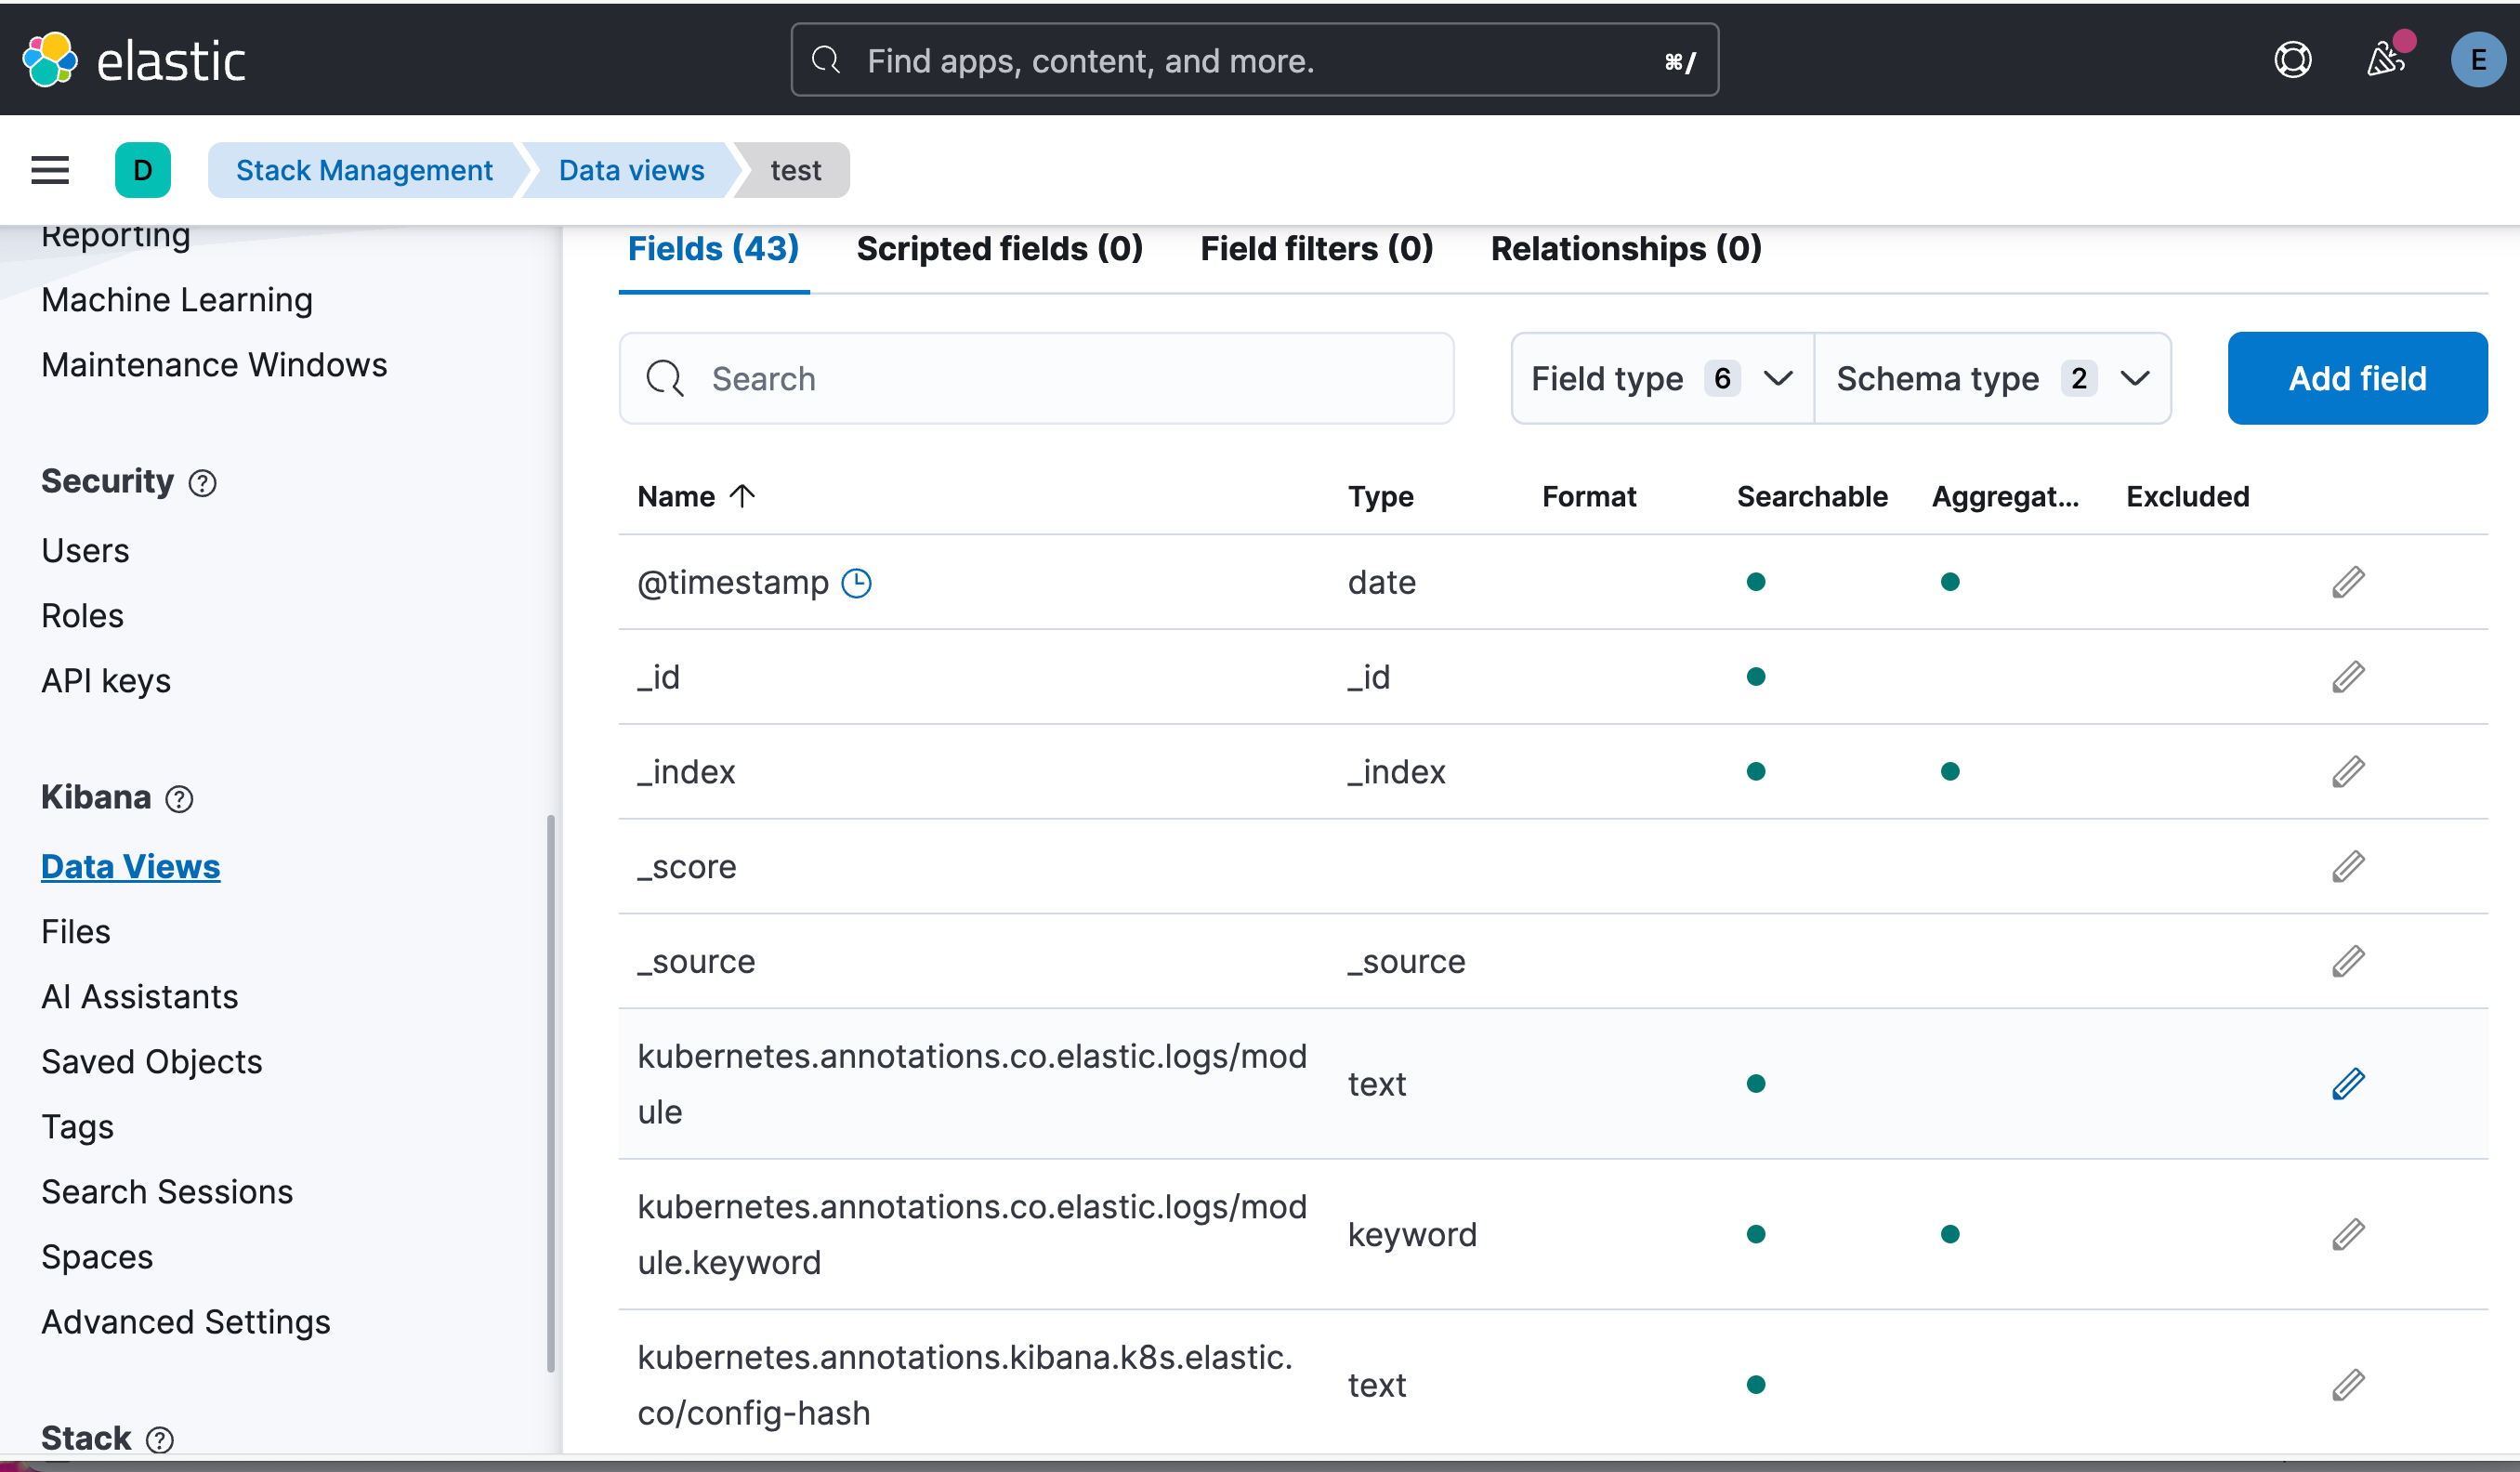
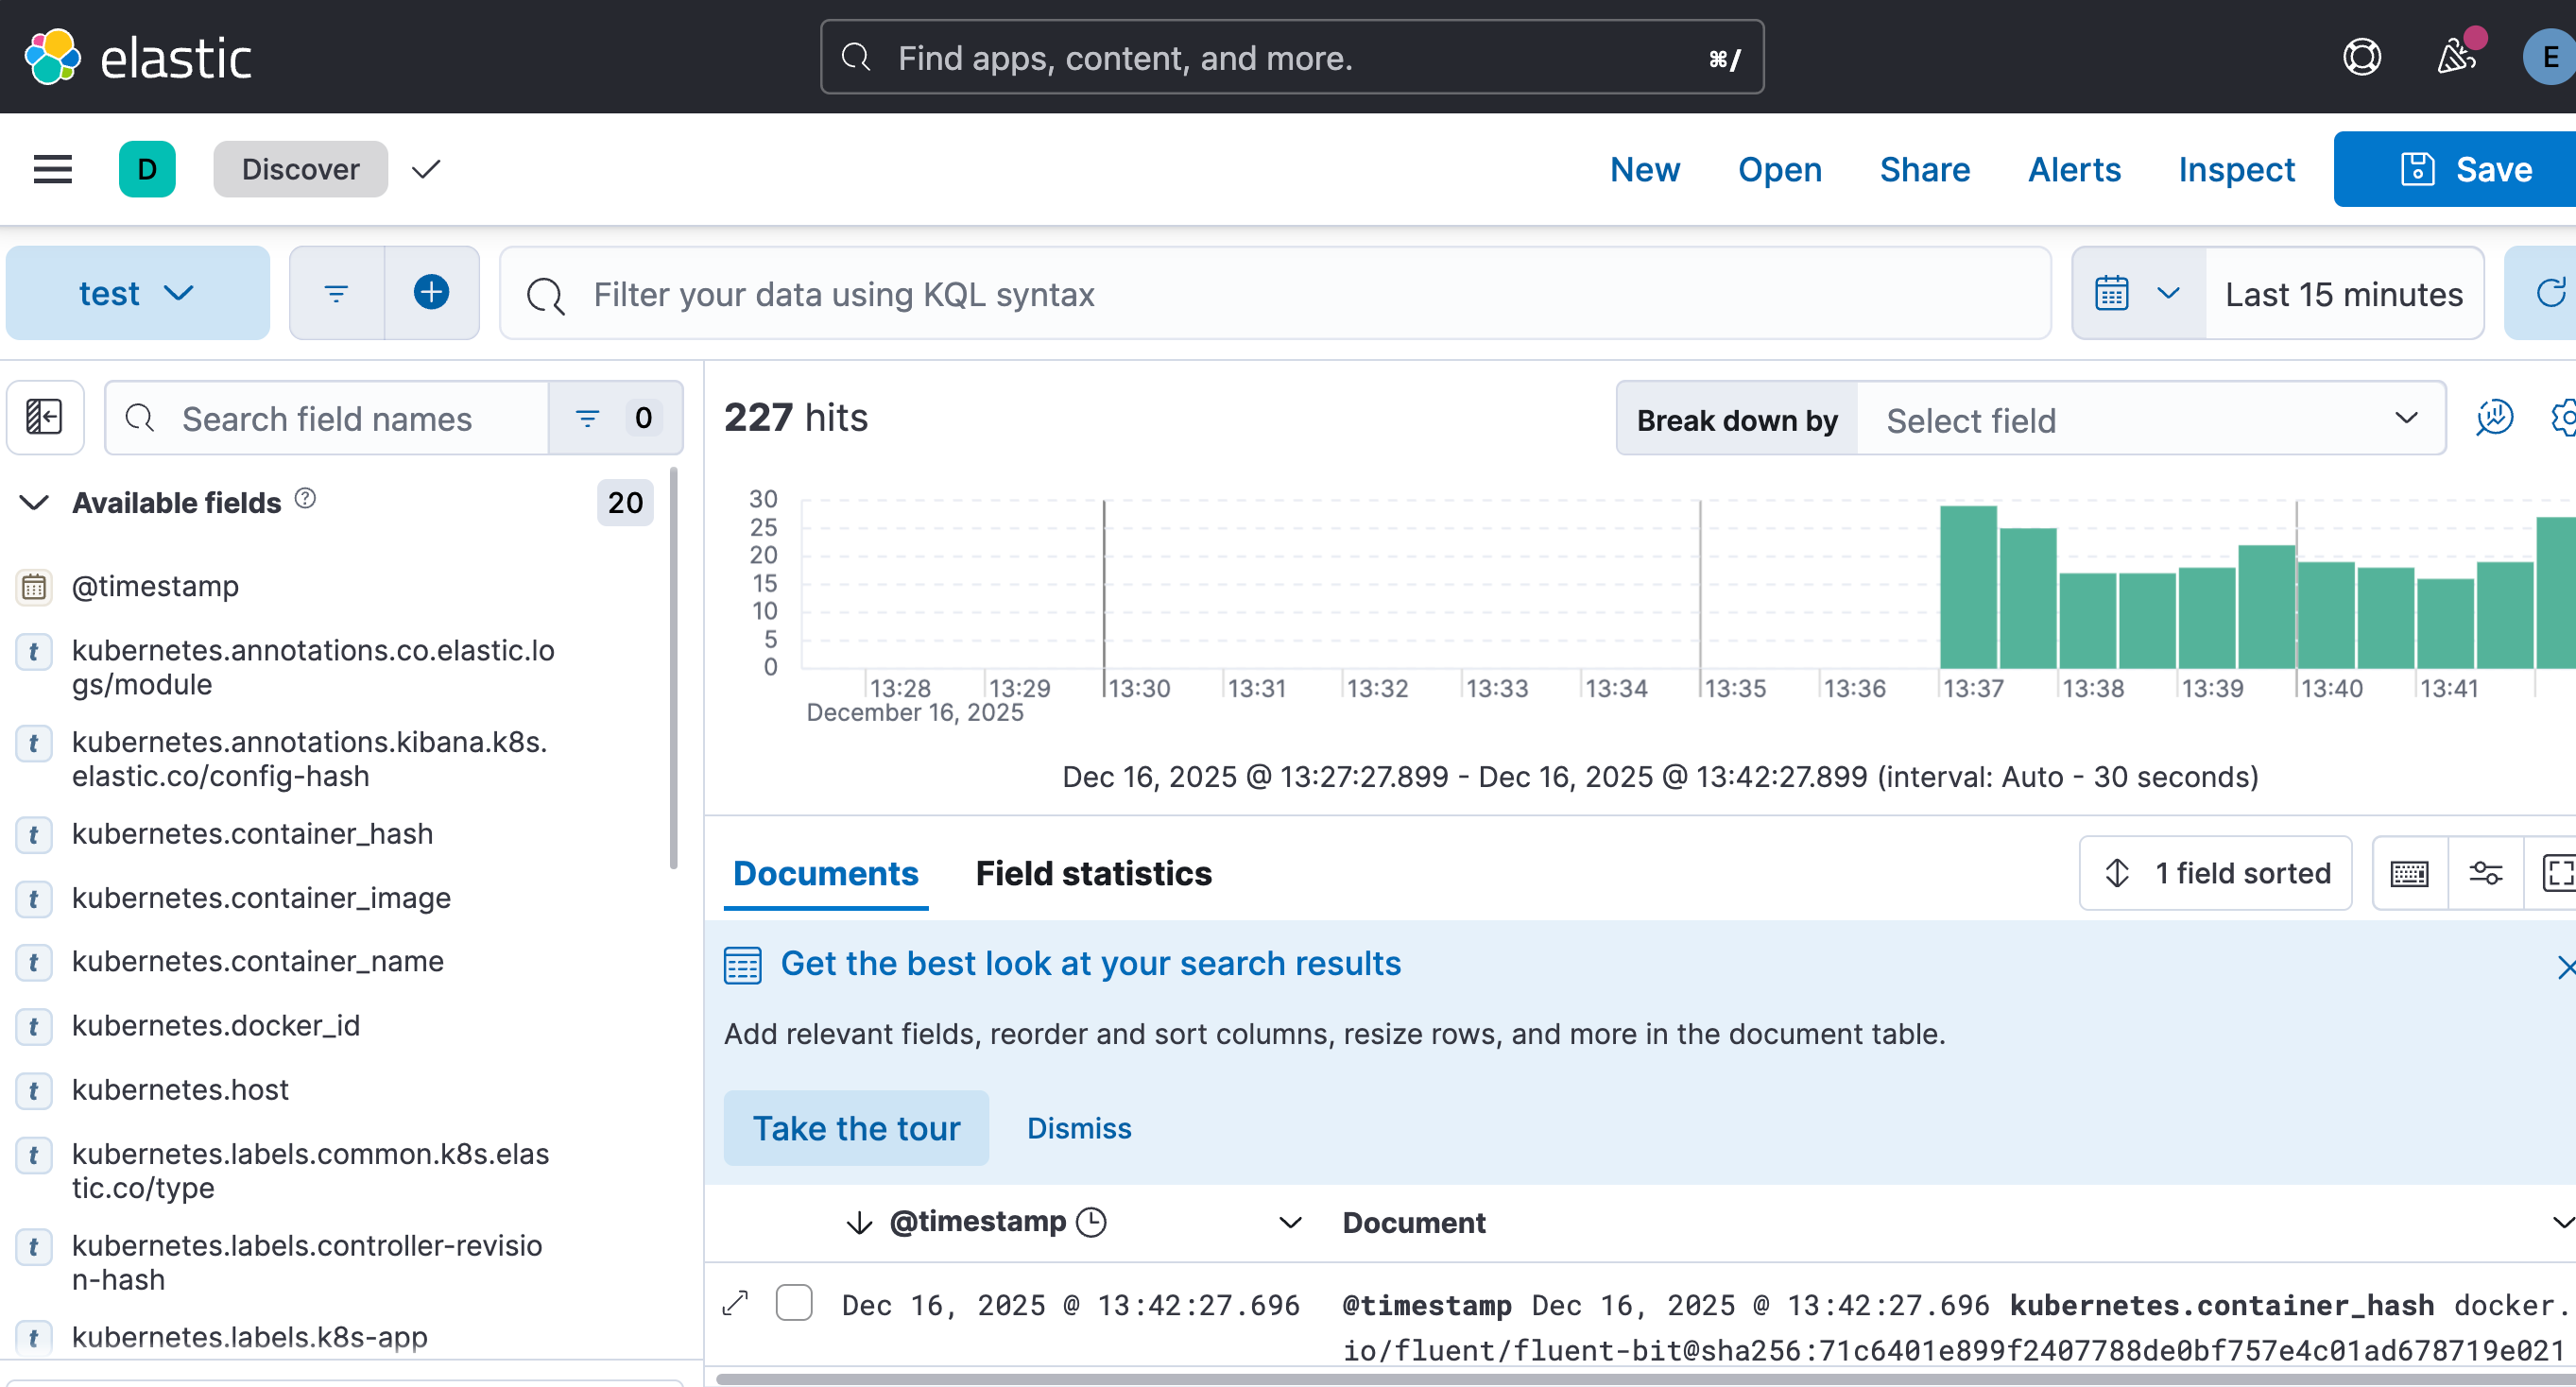
Click the Hamburger Menu (☰) and go to Analytics > Discover.
Ensure your new data view is selected in the dropdown on the left.
You should now see a clean timeline of logs coming from your EKS cluster.